This analysis was completed by Richard Barad as a capstone project for MUSA - 8020 Capstone Project/Advanced Topics In GIS. The project aims to explore how cluster analysis techniques, specifically k-means cluster analysis can be used to map and identify environmental justice areas, and group together census tracts that face similar environmental and socioeconomic vulnerabilities and risks.
Prior to carrying out my analysis I conducted an literature review of existing environmental justice mapping, and provided an over view of the weaknesses and limitations of existing tools and potential areas for improvement. Based on the identified gap, my research aimed to achieve two main goals:
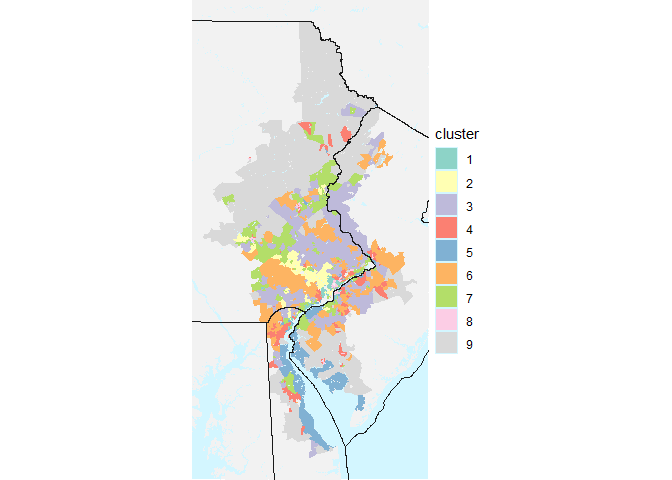
Explore how cluster analysis techniques, specifically k-means cluster analysis can be used for environmental justice mapping. Cluster analysis identifies groups of data that share similar characteristics. In my use case, I aim to identify census tracts that share similar health, environmental, and socioeconomic vulnerabilities. The results of the cluster analysis should also be able to help identify clusters that experience similar compounding hazards and vulnerabilities.
Carryout analysis at a regional scale, using a study area that transcends state boundaries. The results of the cluster analysis, should allow decision makers to make comparisons across a larger region and support regional decision making across sate boundaries.
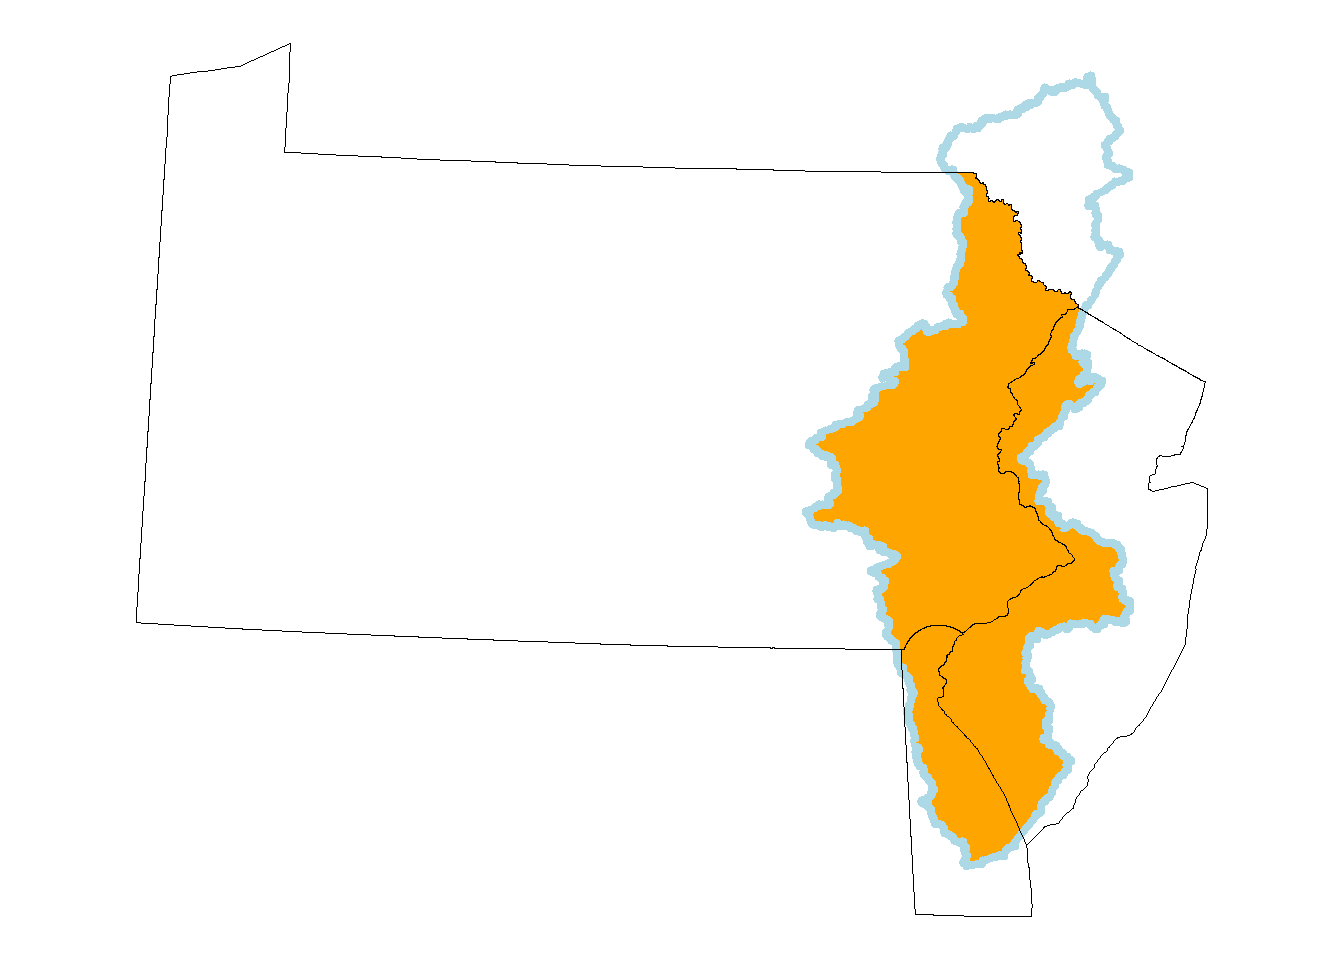
The study area is the Delaware River Basin, specifically the sections of the Basin located in Delaware, New Jersey, and Pennsylvania. The study area is shown in orange in the figure below. A natural boundary like a watershed is chosen as the study area because environmental pollutants do not respect political boundaries. Additionally, environmental planners are often interested in being able to analyze and make comparisons across a natural boundary such as a watershed. A cross-state analysis also allows the results to be more useful for regional level planning and decision making.